Every Nassau County homeowner pays property taxes, but almost no two homeowners have the same experience.
In some school districts, roughly seven out of ten homes recently received a recorded assessment reduction. In others, eight out of ten saw zero relief. Meanwhile, the districts with the highest average tax bills are not always the ones where taxes are climbing the fastest.
That is the central takeaway: there is no single Nassau County tax story. Countywide figures offer a high-level benchmark, but local tax structures and home-specific evidence tell you what is actually happening to your bill.
Most Reductions Were Moderate, Not Dramatic
Data Scope: This reduction analysis is based on a dataset of 330,405 Class 1 residential properties across Nassau County with finalized assessment results for the 2026/27 tax year.
Countywide, 56% of analyzed residential properties showed a recorded assessment reduction, while 44% showed no reduction.
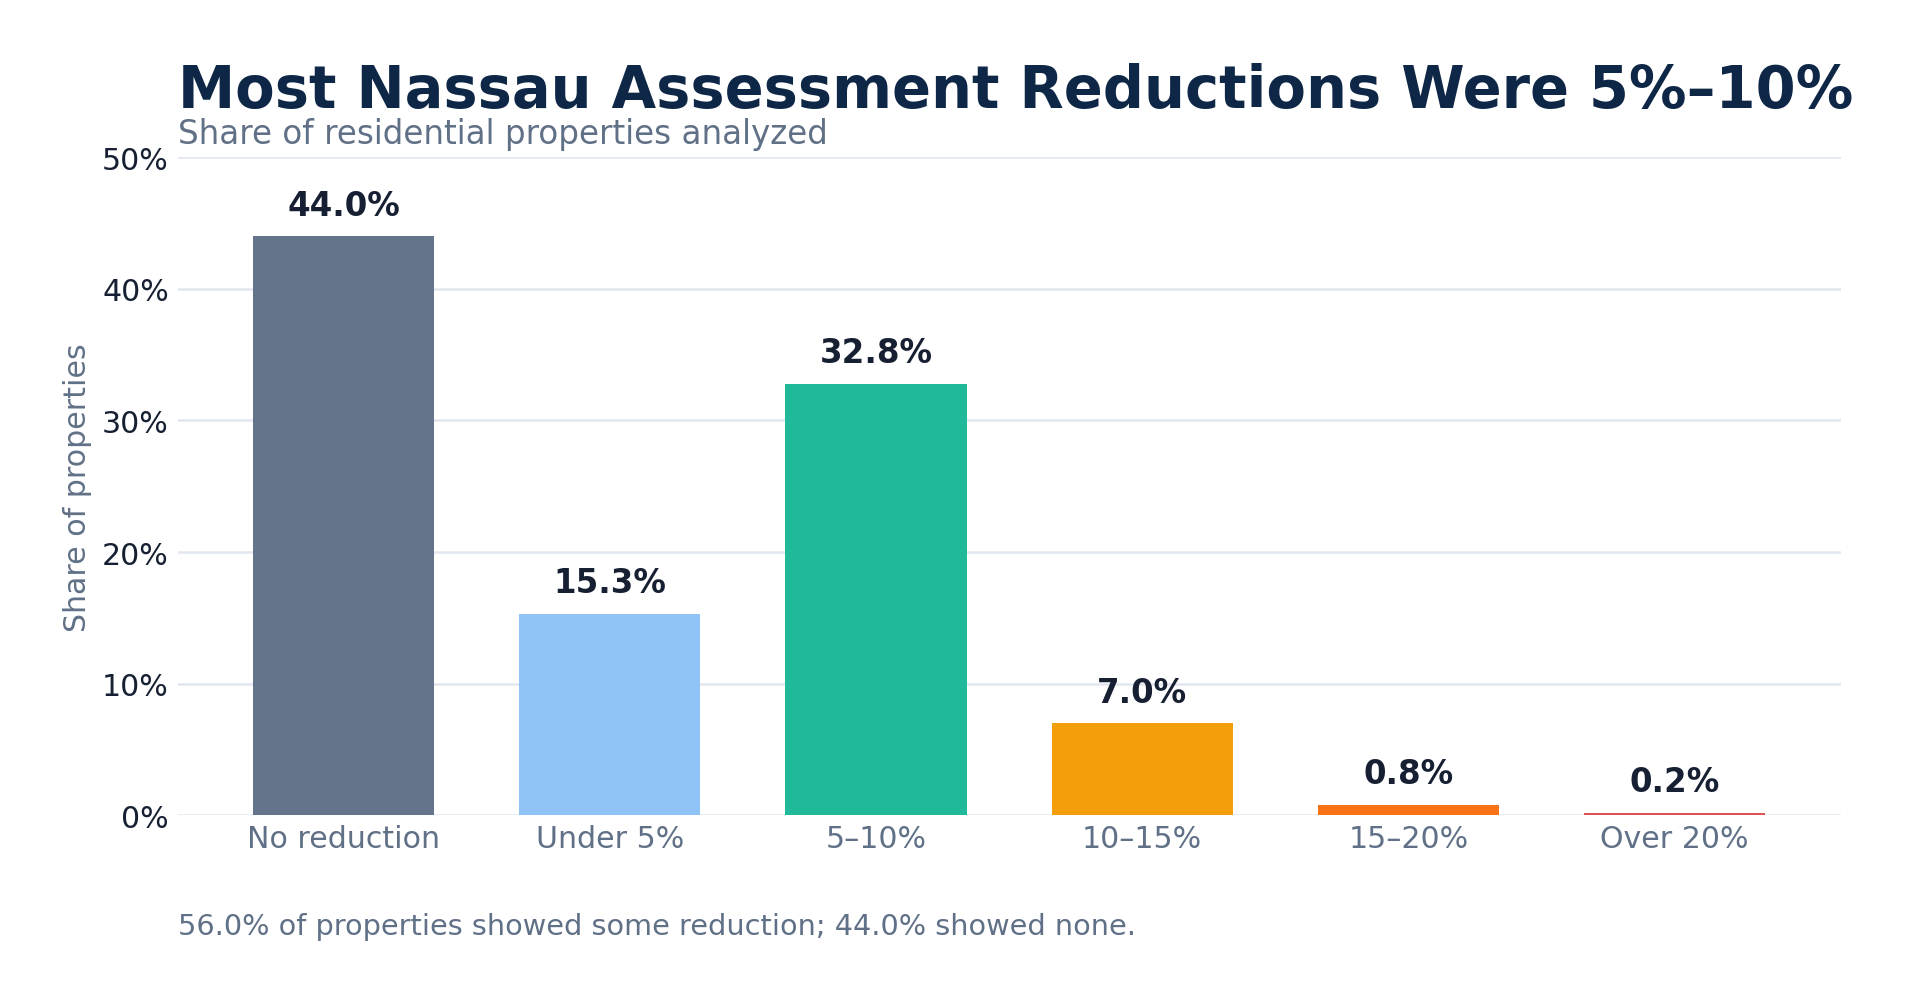
The typical reduction was neither negligible nor transformative:
- Under 5% reduction: 15.3% of properties
- 5% to 10% reduction: 32.8% of properties
- 10% to 15% reduction: 7.0% of properties
- Over 15% reduction: 1.0% of properties
Reductions were common, but massive cuts were rare. For homeowners setting expectations, a recorded reduction typically meant a modest adjustment—not a structural reset of the property's value.
Reduction Patterns Varied Sharply by District
The 56% countywide average conceals massive local divides. The share of properties receiving reductions topped 70% in several districts, while in others, nearly 80% of homes saw no reduction at all.
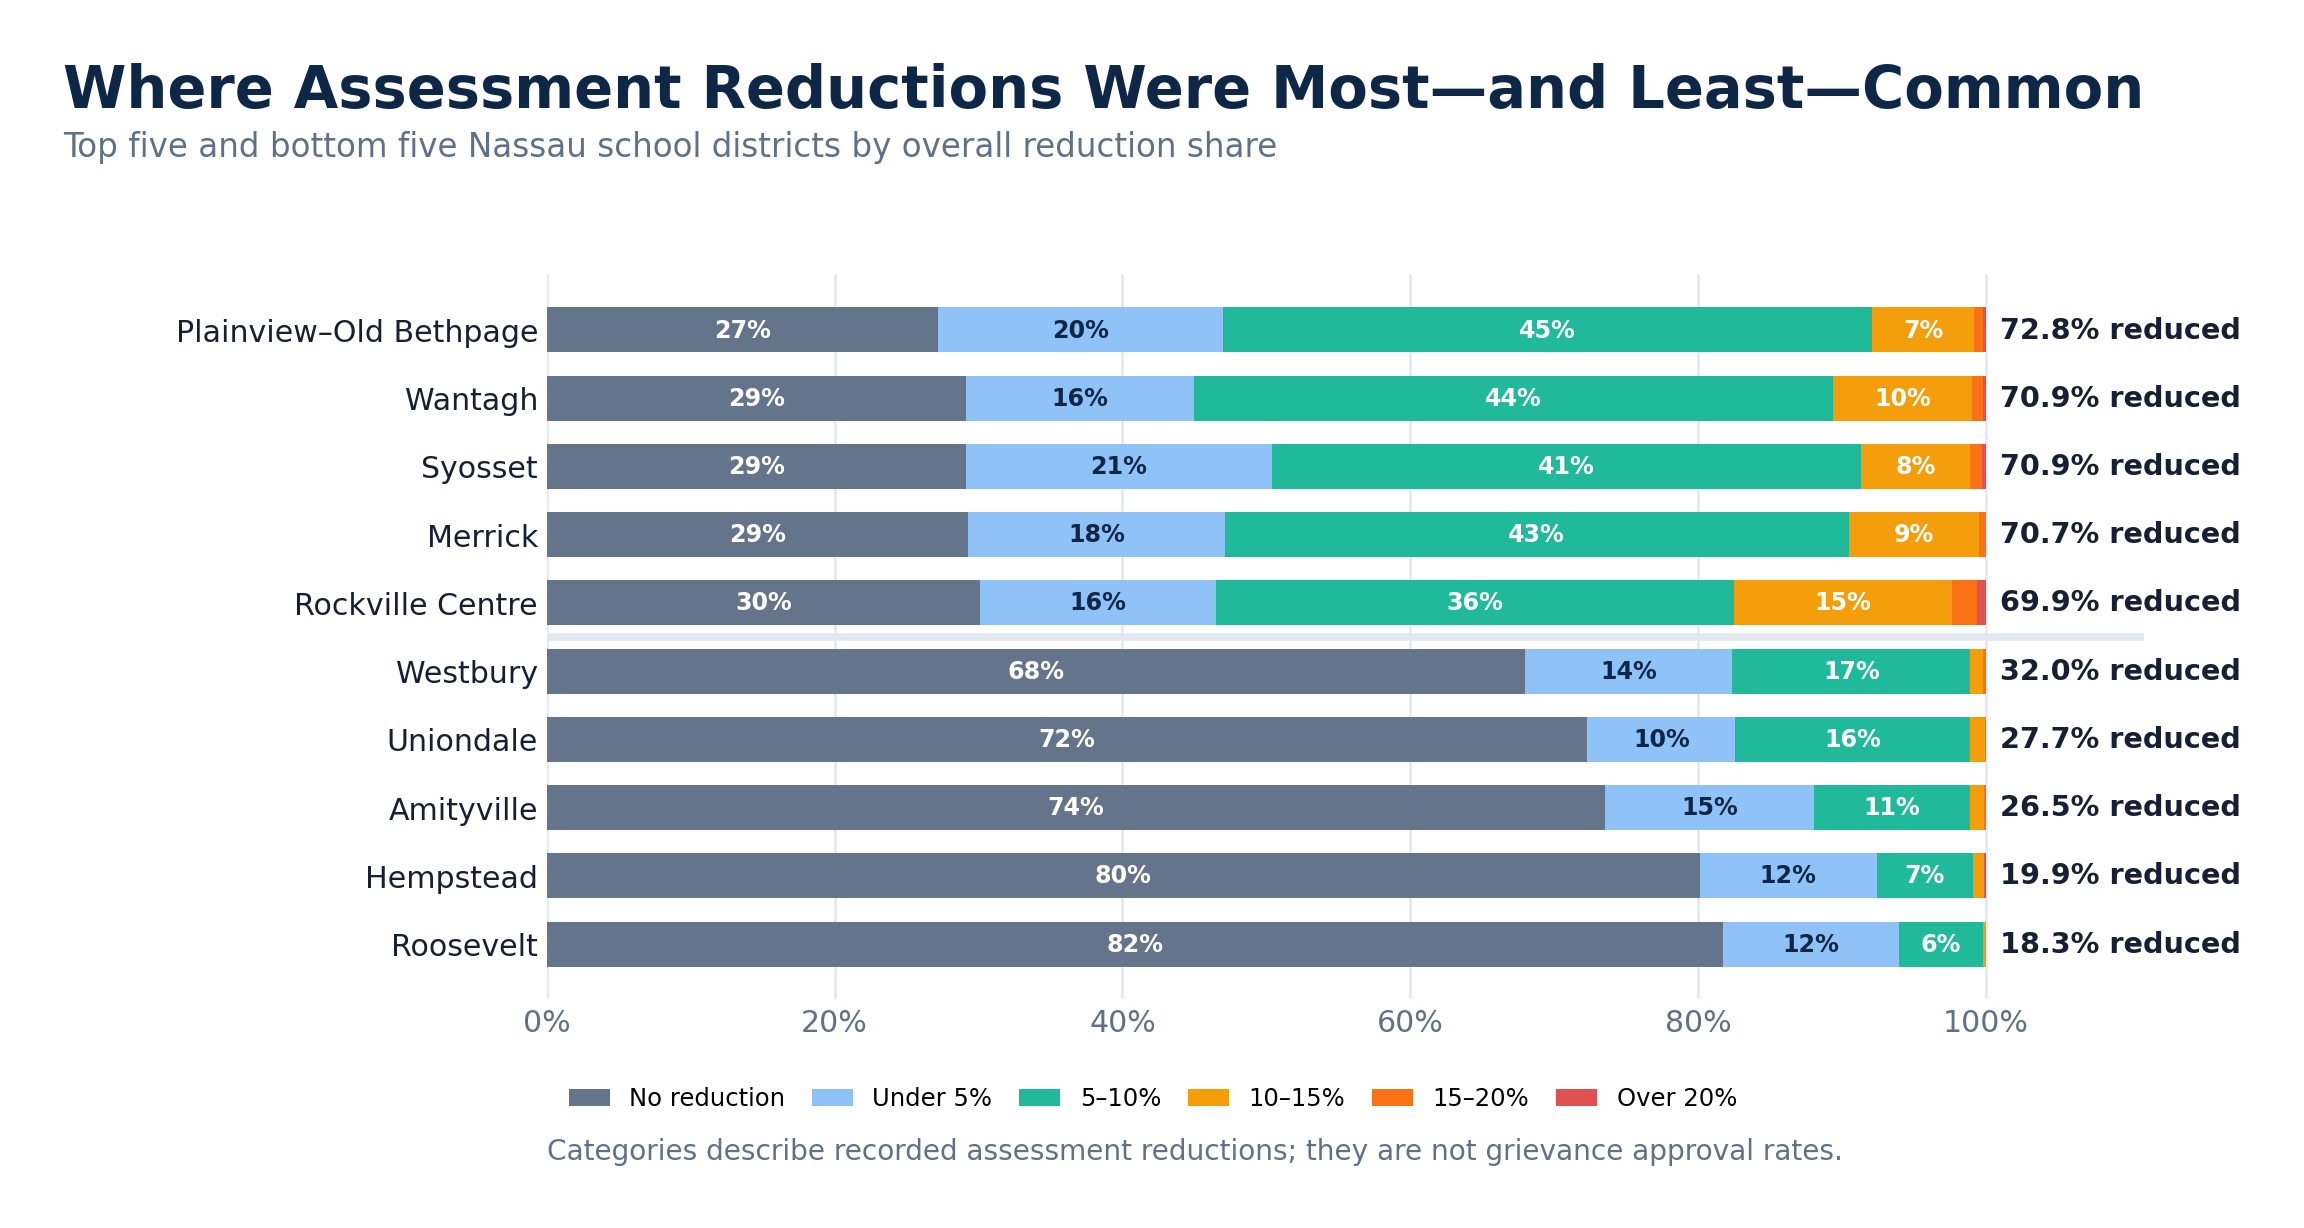
| District (Highest Reduction Share) | % Properties Reduced | District (Lowest Reduction Share) | % Properties No Reduction |
|---|---|---|---|
| Plainview–Old Bethpage | 72.8% | Roosevelt | 81.7% |
| Wantagh | 70.9% | Hempstead | 80.1% |
| Syosset | 70.9% | Amityville | 73.5% |
| Merrick | 70.7% | Uniondale | 72.3% |
| Rockville Centre | 69.9% | Westbury | 68.0% |
These gaps do not mean one district is assessed more fairly than another. They often reflect past grievance activity, local market movements, baseline property values, or recent reassessment adjustments. District stats set the stage, but they cannot prove whether your specific home is overassessed.
Where Average Tax Bills Were Highest
The highest average 2026 total property-tax bills—combining school tax (before exemptions) and general tax—were concentrated along the North Shore and central Nassau:
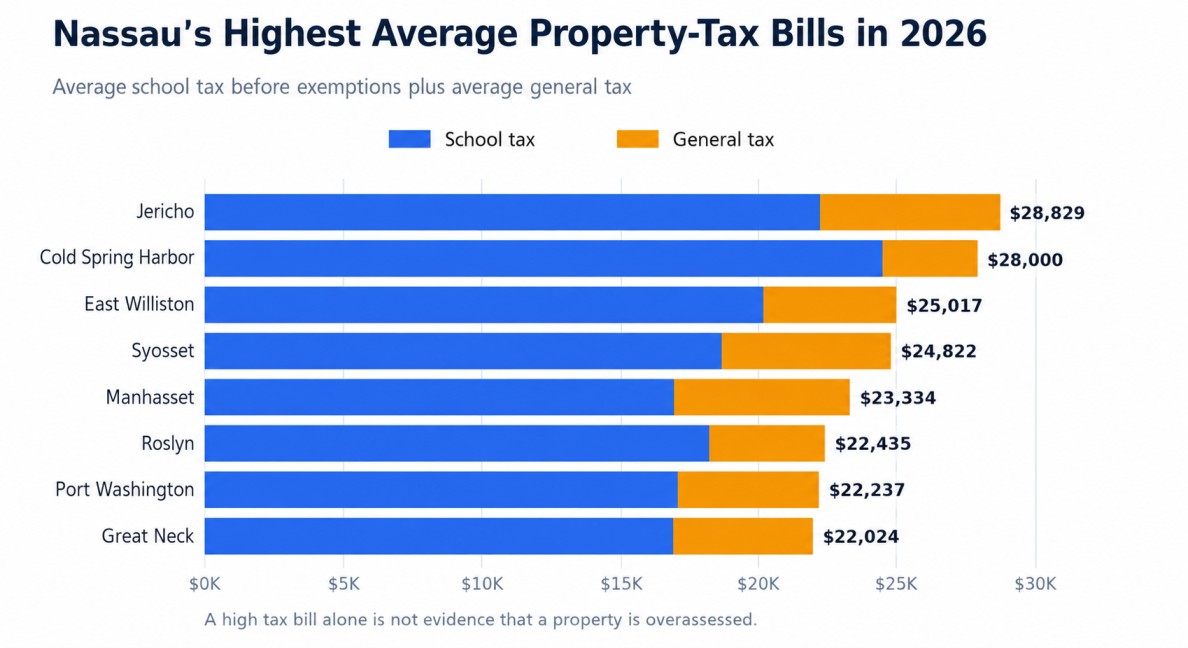
| School District | Average School Tax | Average General Tax | Average Total Tax |
|---|---|---|---|
| Jericho | $22,277 | $6,547 | $28,829 |
| Cold Spring Harbor | $24,538 | $3,462 | $28,000 |
| East Williston | $20,215 | $4,804 | $25,017 |
| Syosset | $18,692 | $6,127 | $24,822 |
| Manhasset | $16,986 | $6,348 | $23,334 |
High bills are driven by multiple moving parts: district budget levies, local commercial tax bases, state aid formulas, enrollment, and property wealth. A high tax bill alone is not proof of overassessment. A correctly valued home can still carry a steep tax bill if it sits in a high-tax district.
Fast Tax Growth Was Primarily a School-Tax Story
Tax levels and tax growth measure two different things. While Jericho had the highest total bill, Island Park saw the fastest percentage growth between 2022 and 2026.
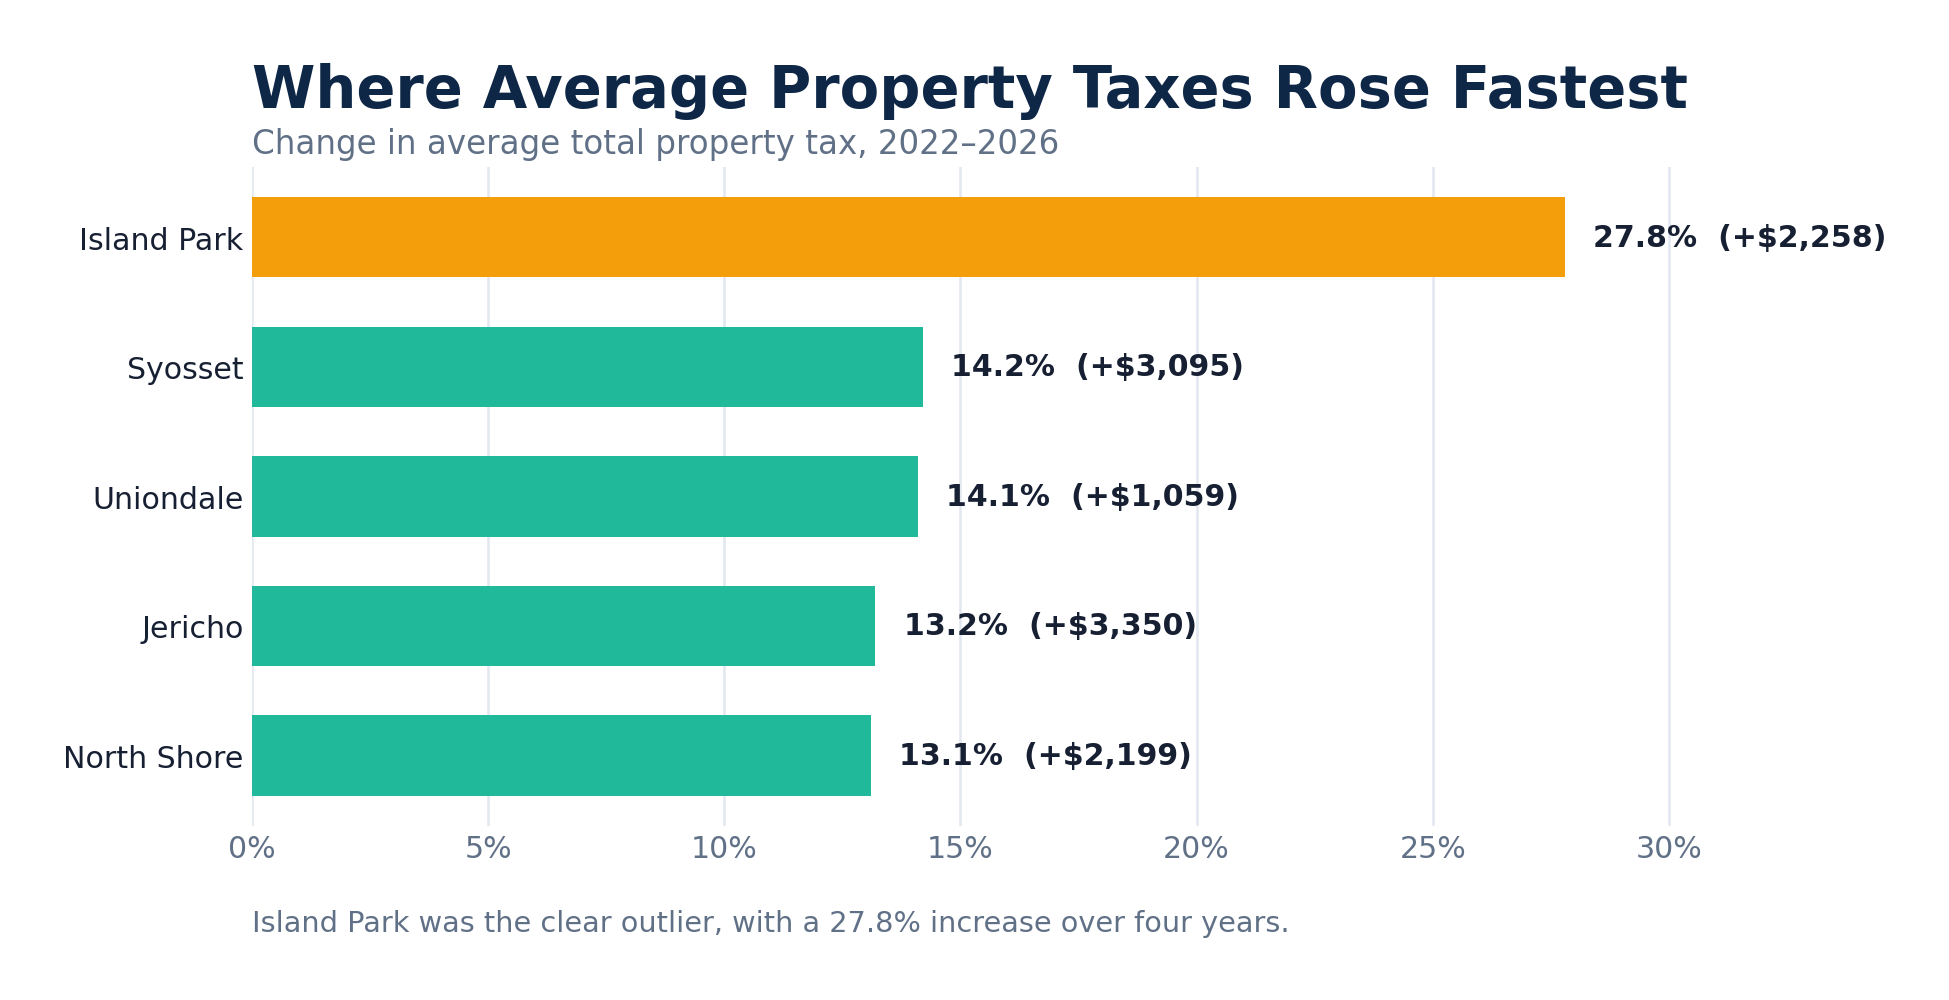
| School District | Total Tax Increase | School Tax Increase | General Tax Increase |
|---|---|---|---|
| Island Park | 27.8% | 38.1% | 4.0% |
| Syosset | 14.2% | 16.0% | 9.3% |
| Uniondale | 14.1% | 18.6% | 5.0% |
| Jericho | 13.2% | 15.2% | 6.6% |
| North Shore | 13.1% | 15.1% | 6.8% |
In every top-growth district, school taxes outpaced general taxes, driven by two distinct factors:
- Tax-Base Shifts (Island Park & North Shore): Following a 2022 settlement, the taxable payments from LIPA’s E.F. Barrett power station in Island Park began declining by ~46.5% over five years. As major commercial contributors pay less, a larger portion of the school levy shifts onto residential homeowners. North Shore experienced a similar dynamic tied to LIPA's Glenwood Landing property.
- Compounding Budget Pressures (Syosset, Jericho, Uniondale): Annual levy growth—even within state tax-cap limits—compounds over time. Rising health insurance premiums, transportation expenses, charter school mandates, and general inflation push school levies higher year after year.
What This Means for Homeowners
1. A steep tax bill doesn't guarantee a successful grievance.
Grieving your taxes isn't about whether your bill feels too high; it's about whether your home’s assessed value matches true market value.
2. District statistics offer context, not proof.
Living in a district with a 72% reduction rate doesn't mean your home is automatically overassessed—just as living in an 80% "no reduction" district doesn't mean you lack a valid case. Winning a tax appeal requires hyper-local proof: comparable home sales, valuation adjustments, and property-specific history.
3. Assessments require an annual review.
A past reduction does not permanently freeze your assessment or guarantee future cuts. Market conditions, tentative assessment roll changes, and comparable sales shift every year.
The Bottom Line
Your district trends show where the local tax landscape is heading. Your property evidence determines whether you have a case to lower your bill.
For full results and data breakdowns across all school districts and cities in Nassau County, read fairvaluetax.com/insights/nassau-county-property-tax-appeal.